The importance of water molecules in protein-ligand binding has become of considerable interest in recent years. Water molecules may enhance the binding affinity between the protein and the ligand by forming bridging hydrogen bonds. Besides, the desolvation energy associated with the displaced water molecules by ligand binding greatly affects the overall protein-ligand binding free energy. Therefore, determination of the key water molecules at the binding pocket helps to understand the protein-ligand association and guide the structural optimization of the ligand.
Experimentally, X-ray crystallography is a commonly used method to identify water molecules in and around protein binding pockets. However, in practical applications, the positions of many key water molecules might be inaccurate or completely unavailable due to the nature of the proteins to be solved or the limitations in crystallographic approach. Therefore, it is very necessary to develop computational methods for determining the water molecules in the binding pocket as a complementary technology.
Currently, a variety of methods have been developed for predicting the locations of water molecules in the binding pocket or on the surface of a protein molecule. A popular approach is to merge the protein molecule into a pre-equilibrated box of water molecules and then run a long molecular dynamics (MD) simulation. Water molecules will re-distribute on the protein surface along this process, such as WaterMap, WATsite etc. The second approach is based on Monte Carlo (MC) simulation, such as GCMC (grand-canonical Monte Carlo) and JAWS method. The third one is statistical potential or molecular mechanics methods. For example, the 3D reference interaction site model (3D-RISM) theory is based on the statistical mechanics integral equation theory of molecular liquids. Three dimensional distributions of solvent molecules (e.g. water) around the solute molecule can be obtained by solving the 3D-RISM equation, which represents the probability of finding the solvent molecules. The Placevent algorithm and GAsol were developed to analyze the water locations provided by 3D-RISM calculation. Other methods include SZMAP, etc.
We developed an empirical method for predicting the favorable hydration sites in a protein binding pocket. This method, namely HydraMap, is suitable for high-throughput tasks, such as docking-based virtual screening. In order to balance speed and accuracy, we select knowledge-based statistical potentials (also referred to as potential of mean forces, PMFs) to quantify the interactions between a water molecule and its surround environment. Our method HydraMap was divided into two steps. The first step is to estimate the probability of a water probe placed at any location in the binding pocket. At the second step, a density-based clustering algorithm is used to determine the most probable locations for a water molecule. Our HydraMap method was validated on two external data sets, and achieved acceptable and consistent accuracy on both data sets with an overall success rate around 66-70%, which was essentially comparable to the results given by WATsite and 3D-RISM. But it is about 1000-fold faster than WATsite and 30-fold faster than 3D-RISM on a single protein structure. It has potential applications to high-throughput tasks, such as virtual screening.
2. Principle
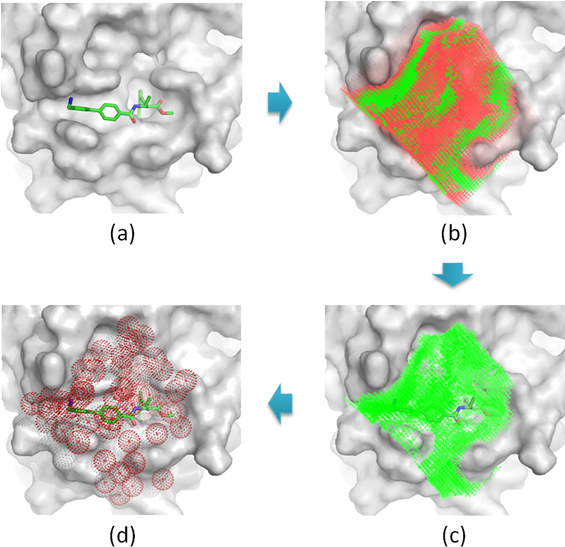
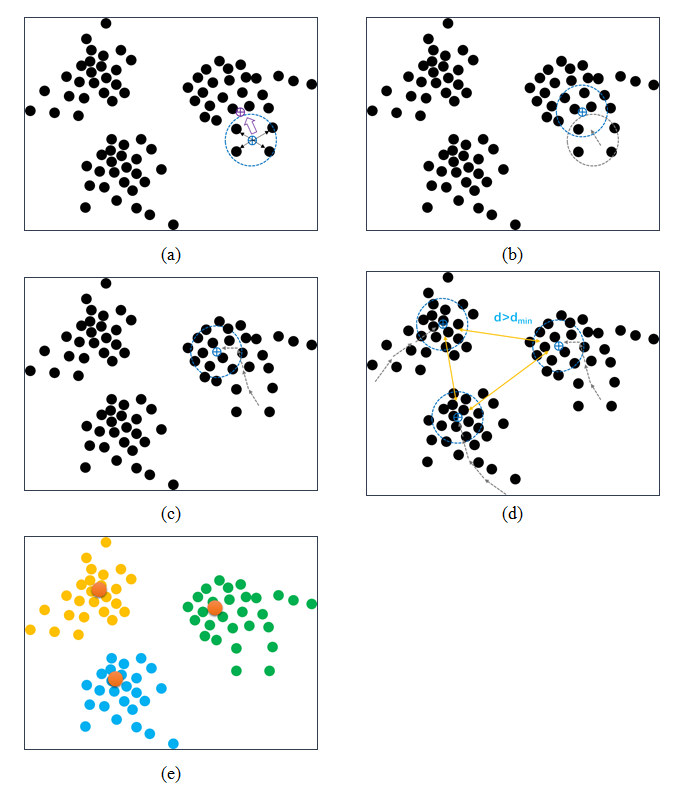
The possible locations of water molecules inside the binding pocket of a given protein structure were predicted based on the W-PMF potentials. Such locations are referred to as "hydration sites". The basic workflow of this process is illustrated in Figure 1. At the first step, the binding pocket on the protein is defined by a cuboid box large enough to enclose a known ligand molecule binding to this protein with a margin of D. Cubic grids are generated within the box with an interval of grid_spacing Å at each dimension. Note that the information of the bound ligand molecules is used only for defining the boundary of the box. This task can also be done by simply setting the center and each dimension of the box. At the second step, a water probe is placed on each grid to compute its PMF energy by using the W-PMF potentials. Considering the nature of W-PMF potentials, this PMF energy should rather be interpreted as a measurement of the probability of observing a water molecule on this grid. The grids with their computed PMF energies above a defined cutoff E are ignored at the following steps because they are energetically unfavorable. At the third step, the remaining grids are clustered by a mean-shift algorithm (Figure 2), and the center of each cluster with N grid points represent a potential hydration site.
The HydraMap software suite is now freely available for academic users. The HydraMap suite includes the source codes and executable codes (for Linux platforms) of all major functions, the user manual, and the necessary material for running the several demo examples described in our publication. It is provided as a [TAR.gz package] (3.09 MB in size).
Reference:
- Yan Li, and Renxiao Wang*, "HydraMap v1: ", Journal of XXXX, 2020, in revision